Analysis
Circular Dichroism Spectroscopy
Circular Dichroism, CD, spectroscopy is a common analytical method applied for the characterization of folding behavior in peptides, proteins, and related biomacromolecules. A CD experiment measures the difference in absorption of left- vs. right-handed circularly polarized light as a function of wavelength. For peptides and proteins, CD spectral characteristics of the backbone amide chromophores in the far UV region, ~190-260 nm, show characteristic features that vary with secondary structure content.
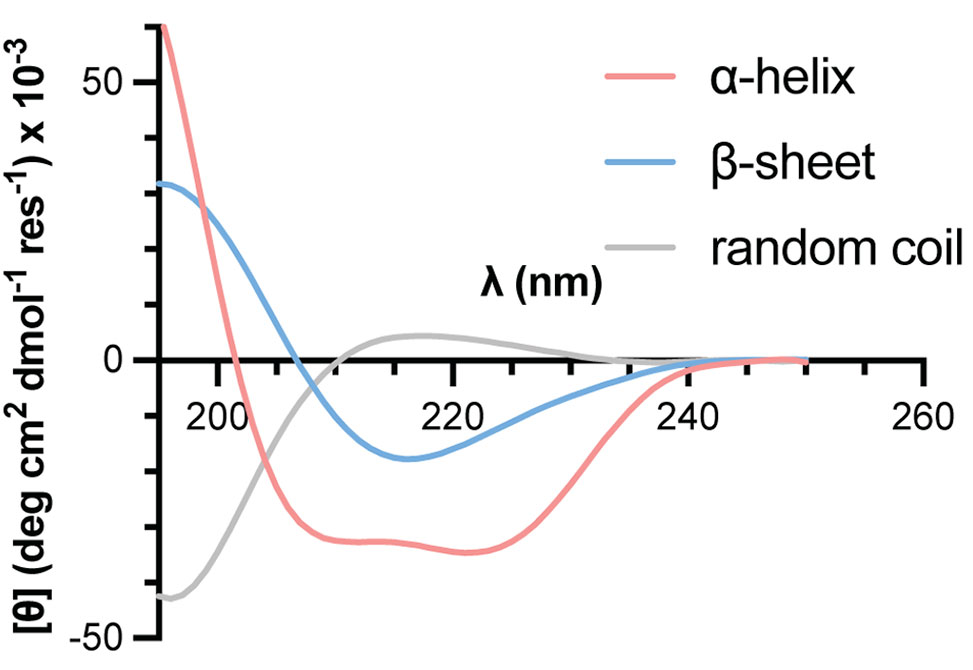
Given access to suitable instrumentation, measurement of a CD spectrum is a relatively straightforward method to give qualitative insights into secondary structure preferences of a synthesized peptide using minimal material. The protocol below gives an overview of steps to perform a basic CD measurement.
Protocol
-
Prepare a solution of peptide in buffered water. Employ the minimal concentration of buffer and salt needed to maintain the desired pH and also support folding of the peptide under study. A reasonable first attempt for a measurement on a new system would be a sample composition of 100 μM peptide in 10 mM phosphate buffer at pH 7.
-
Prepare a corresponding matched buffer blank solution identical to the above but without peptide.
-
Using a micropipette, transfer the buffer blank solution to a 1 mm path length quartz cuvette.
-
Acquire a CD spectrum of the blank in the range of 195-260 nm, see relevant details from documentation for the CD instrument used.
-
Rinse the cuvette with water, then methanol, then dry under a gentle stream of dry nitrogen.
-
Using a micropipette, transfer the peptide solution to the 1 mm cuvette and acquire a CD spectrum of the peptide using the same instrument settings as above.
-
Subtract the buffer CD spectrum from the peptide CD spectrum.
-
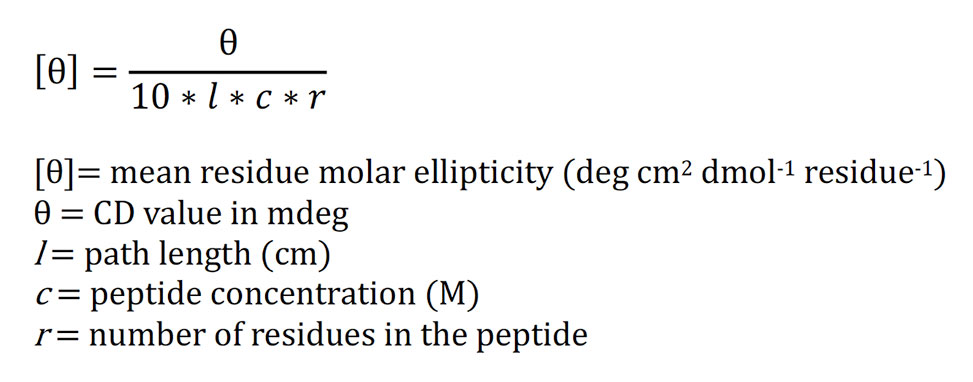
Convert the resulting CD values at each wavelength, typically output by the instrument in mdeg, to mean residue molar ellipticity according to the following equation.
Additional Reading
Greenfield, N. (2006). Using circular dichroism spectra to estimate protein secondary structure. Nature Protocols, 1, 2876–2890. https://doi.org/10.1038/nprot.2006.202, provides a leading reference to further reading on CD theory, experimental design, and data analysis.
NMR Spectroscopy for Peptide Structure Determination
NMR spectroscopy is one of the most powerful methods to explore the structure and dynamics of peptides in solution. The three-dimensional solution structures of peptides, and in particular the number of intramolecular hydrogen bonds, influence several properties, such as solubility and membrane permeability.
NMR Spectroscopy provides information of peptide sequence and characterization, the intramolecular hydrogen bonds within the peptide structure, as well as the number of conformations present in different solvent environments. NMR-based structure determination of peptides comprises several steps including NMR data acquisition, determination of conformational constraints, and calculation of ensembles of 3D solution structures.
Sample Preparation
Typical 1D and 2D NMR spectra analysis of peptides requires 1-2 mg of compound for a good quality of NMR data. The concentration of peptide has effect on the quality of spectra, quality of peaks, shimming of the system, et cetera. Using proper deuterated solvent with the required amount depending on the NMR system is also another parameter to get a high quality of NMR spectra.
Resonance Assignments and Structural Restraints
Sequence-specific NMR resonance assignments to each amino acid in the peptide sequence need to be obtained before structure determination can be attempted. For a small non-labeled-peptide, the primary 2D 1H-NMR experiments used for resonance assignments of peptides include correlation spectroscopy, COSY, or double-quantum filtered correlation spectroscopy, DQF-COSY, total correlation spectroscopy, TOCSY, and nuclear Overhauser effect spectroscopy, NOESY/Rotating-frame Nuclear Overhauser Effect spectroscopy, ROESY.
1D Proton NMR:
1D proton NMR of peptides gives a quick information on number of conformations of peptide in solution, aggregation problem et cetera. Additionally, 3JHN-Hα scalar couplings that are used to derive backbone torsional restraints used in the structure calculations can be extracted from amide proton region of 1D proton NMR if the amide proton peaks are well-separated and sharp enough. J-couplings provide another source of information for peptide structure determination. 3JHN-Hα scalar couplings derived from either 1D proton or 2D COSY spectra are converted to backbone dihedral angle restraints using the Karplus equation below.
3JHN-Hα = 6.4 cos2Θ – 1.4 cosΘ + 1.9
There exists a relationship between the 3JHN-Hα couplings and secondary structure of peptides. Values of 3JHN-Hα less than 4.5 Hz are indicative of α-helical structure, whereas values greater than 8.5 Hz are found for residues in β-strands. 3JHN-Hα values in the range 5-8 Hz potentially result from averaging over multiple peptide conformations present in the solution, and as such should only be used when employing time-averaged or ensemble-averaged restraints in structure calculations.
2D TOCSY – Total Correlation Spectroscopy:
TOCSY spectra provide through-bond intra-residue correlations in the same spin systems via spin-spin couplings and it give characteristic peak patterns for identifying amino acid type that are called that are fingerprints of amino acids. Since protons from different amino acids belong to different spin system, it is one of the major experiments to identify each residue in the peptide structure.
2D COSY – Correlated Spectroscopy:
COSY spectra give information on proton-proton correlations due to through-bond couplings. Similar to TOCSY, position of cross peaks in COSY are also characteristic for each amino acid. It gives primarily information of the connectivity in each amino acid. Additionally, cross-peaks of 2D COSY spectra are used to determine 3JHN-Hα scalar couplings to convert to backbone dihedral angle restraints using the Karplus equation above.
2D NOESY and ROESY:
Nuclear Overhauser Effect Spectroscopy or Rotating-frame Nuclear Overhauser Effect spectroscopy. Cross-peaks of NOESY and ROESY spectra provide information that can be used to locate the spin systems within the peptide sequence via through-space, sequential NOE/ROE connectivity between adjacent residues. The intensities of cross-peak volumes depend on the distance between protons; thus, the distance restraints are calculated from the cross-peak volumes observed in NOESY or ROESY spectra. The NOE/ROE cross-peak volumes can be converted into interproton distances based on the 1/r6 dependence of the volume on the internuclear distance.
The NOE signals depend on the interproton distances, the observation frequency, w, and the rotational correlation time, tc, and, hence, the size of the molecule. The NOE signal changes sign at wtc ≈ 1.12, which leads to little or no NOE signal being observed for medium-sized compounds, MW 500-2,000 Da, which is clearly an impediment for the extraction of distance information from NOESY spectra of peptides in this size range, see Figure 1. This issue can be overcome by using rotating-frame nuclear Overhauser effect spectroscopy, ROESY, which gives negative cross peaks for all values of wtc. A disadvantage of using ROESY spectra, however, is the presence of TOCSY cross peaks due to J couplings, which can seriously complicate the extraction of distance restraints. To overcome this drawback, the Efficient Adiabatic Symmetrized ROESY, EASY-ROESY, pulse sequence may be used to suppress TOCSY spectral artifacts.
The sequential order of NMR spin systems in a peptide sequence is determined by NOE/ROE sequential walking through the amide proton region of the NOESY or ROESY spectrum. Sequential walking is interrupted by the presence of proline or N-methyl amino acids in the peptide sequence, which lack backbone HN protons. The presence of proline, proline analogues, or N-methyl amino acids further complicates spectral analysis due to cis/trans peptide bond isomerization, which frequently occurs in the NMR slow exchange regime resulting in separate signals corresponding to the cis and trans isomers in the spectra of the peptides. Analysis of the NOE signals can be used to assign the peptide bond isomerization – a strong NOE signal between the HN of residue i and the Ha of residue i + 1 indicates a cis-peptide bond.
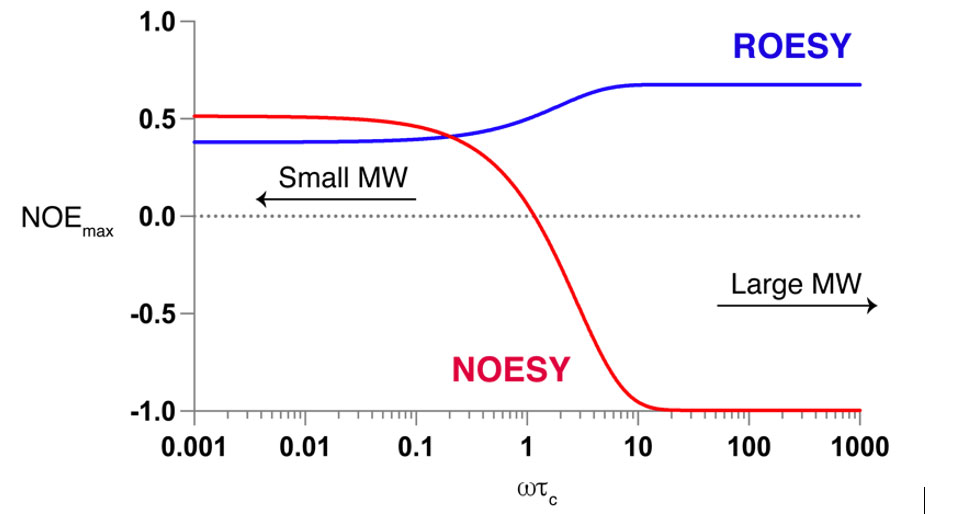
Figure 1. NOEs from NOESY spectra are positive for small molecules, MW < 600, goes through zero for medium-sized molecules, 700 <MW < 1200, and becomes negative for large molecules, MW > 1200. On the other hand, ROESY is always positive, thus, it is preferred for medium-size molecules.
3D Solution Structure Determination of Peptides
NMR data, including NOE distance restraints and J-couplings, can be used to calculate the 3D solution structures of peptides by using software packages developed for NMR-based protein structure determination, such as, CYANA CNS, or Xplor-NIH, or, alternatively, the NAMFIS, NMR Analysis of Molecular Flexibility in Solution, method.
The protein structure determination algorithms typically use torsion-angle molecular dynamics, MD, where the only degrees of freedom are rotations about covalent bonds – the NMR-derived restraints are added as additional force field terms. The standard simulated annealing protocol in, for instance, CYANA, initiates from a conformation in which all torsion angles are treated as independent, uniformly distributed random variables and comprises five stages.
These include initial minimization to reduce high-energy interactions that could disturb the torsion angle dynamics algorithm, a high-temperature phase, slow cooling to a low temperature, a low-temperature phase for checking steric overlaps, and a final energy minimization phase. Multiple calculation cycles yield a number of low-energy conformers that satisfy the experimental NMR-derived restraints. The quality of the calculated structures is evaluated based on the number and magnitude of violations from the experimental restraints, distribution of the backbone dihedral angles in the Ramachandran plot, and residue-specific root mean square deviations, RMSDs, for backbone and heavy atoms.
One challenge frequently encountered when using programs such as CYANA for calculating peptide structures is the incorporation of non-proteinogenic amino acids and cyclization chemistries. In order to use CYANA for such peptides, the algorithm has been extended through the use of the CYLIB program, which automatically generates the residue topology files required for the torsion-angle molecular dynamics algorithm used within CYANA for the structure calculations. CYLIB typically uses the structure database in the PDB Chemical Component Dictionary to generate new topology files in the CYANA residue library format. However, topology files for some non-natural amino acids still need to be created using other methods, such as quantum mechanical modeling methods, such as, DFT calculations, and then converted into the CYANA format using the CYLIB converter.
NAMFIS is an alternate method for solution structure elucidation of peptides, and is particularly useful for the analysis of flexible peptides. The NAMFIS protocol essentially comprises two steps. The initial step entails generation of a “complete” set of possible molecular conformations that includes potential members of the solution ensemble. The averaged NMR-derived NOE distances and J-couplings are then deconvoluted by varying the molar fractions of the computed theoretical ensemble until the best fit to the experimental NMR data is obtained.
The result is an ensemble of all conformations present in solution, together with their probabilities, which provides a better understanding of the solution state than is possible through average structure calculations. The overall quality of the structural ensembles determined by the NAMFIS method depends on the diversity of the conformational sampling pool employed, along with the NOE-distances and J-couplings extracted from the NMR data. A significant challenge with using the NAMFIS method is, thus, the problem of efficient and complete conformational sampling of large flexible compounds.
Analysis of Intramolecular Hydrogen Bonds
Intramolecular hydrogen bonds, IMHBs, in peptide structures can significantly impact peptide properties, such as solubility and membrane permeability. While exposure of the amide bonds in the peptide backbone to solvent is associated with poor membrane permeability, shielding of backbone amide protons through IMHBs can significantly enhance passive cell permeability.
Amide proton temperature coefficients, ΔδHN/ΔT, are derived by correlating 1H-NMR chemical shifts of backbone amide protons with temperature. The chemical shifts of the amide protons depend on the inverse third power of the distance between the amide proton and its hydrogen-bond acceptor. Generally, amide protons with temperature coefficients more negative than -4.6 ppb/K can be classified as “solvent-exposed,” and more positive than -4.6 ppb/K can be classified as “shielded” due either to strong IMHBs or steric shielding from solvent interactions by, for example, neighboring aromatic rings. If 1H NMR analysis for the chemical shift temperature dependence fails due to extensive signal overlaps, 2D-TOCSY spectra can be used to determine the temperature coefficients.

Conformational Analysis of Peptides by NMR Spectroscopy
Conformational analysis of peptides is usually performed in either polar solvents mimicking the aqueous environment, such as dimethyl sulfoxide, DMSO, acetonitrile, ACN, methanol, or pyridine, or in nonpolar solvents mimicking the membrane interior, such as chloroform, CDCl3, tetrahydrofuran, THF, or dichloromethane, DCM, depending on the solubility of the peptide. DMSO or ACN/water mixtures are most commonly used for high-dielectric conformational analysis mimicking the aqueous environment. To understand the conformational switch of peptides from an aqueous to a membrane environment, chloroform is most commonly used as the NMR solvent since its dielectric constant, ε = 4.8, is most similar to that of a cell membrane, ε = 3.28.
More Readings
Cavanagh, J., Fairbrother, W. J., Palmer, A. G., Rance, M., & Skelton, N. (2007).
Protein NMR spectroscopy: Principles and practice.
Elsevier: Amsterdam.
Thiele, C. M., Petzold, K., & Schleucher, J. (2009).
EASY ROESY: Reliable Cross-Peak Integration in Adiabatic Symmetrized ROESY.
Chemistry – A European Journal, 15(3), 585-588.
Ammalahti, E., Bardet, M., Molko, D., & Cadet, J. (1996).
Evaluation of distances from ROESY experiments with the intensity-ratio method.
Journal of Magnetic Resonance A, 122(2), 230-232.
Stewart, D. E., Sarkar, A., & Wampler, J. E. (1990).
Occurrence and role of cis peptide bonds in protein structures.
Journal of Molecular Biology, 214(1), 253-260.
Kern, D., Schutkowski, M., & Drakenberg, T. (1997).
Rotational barriers of cis/trans isomerization of proline analogues and their catalysis by cyclophilin.
Journal of the American Chemical Society, 119(36), 8403-8408.
Farley, K. A., Che, Y., Navarro-Vazquez, A., Limberakis, C., Anderson, D., Yan, J. L., Shapiro, M., Shanmugasundaram, V., & Gil, R. R. (2019).
Cyclic Peptide Design Guided by Residual Dipolar Couplings, J-Couplings, and Intramolecular Hydrogen Bond Analysis.
Journal of Organic Chemistry, 84(8), 4803-4813.
Landis, C., & Allured, V. S. (1991).
Elucidation of Solution Structures by Conformer Population Analysis of NOE Data.
Journal of the American Chemical Society, 113(25), 9493-9499.
Wishart, D. S., Sykes, B. D., & Richards, F. M. (1992).
The Chemical Shift Index: A Fast and Simple Method for the Assignment of Protein Secondary Structure through NMR Spectroscopy.
Biochemistry, 31(6), 1647-1651.
Guntert, P. (2009).
Automated structure determination from NMR spectra.
European Biophysics Journal, 38(2), 129-143.
Cicero, D. O., Barbato, G., & Bazzo, R. (1995).
NMR Analysis of Molecular Flexibility in Solution – A New Method for the Study of Complex Distributions of Rapidly Exchanging Conformations – Application to a 13-Residue Peptide with an 8-Residue Loop.
Journal of the American Chemical Society, 117(3), 1027-1033.
Yilmaz, E. M., & Guentert, P. (2015).
NMR structure calculation for all small molecule ligands and non-standard residues from the PDB Chemical Component Dictionary.
Journal of Biomolecular NMR, 63(1), 21-37.
Bonnet, P., Agrafiotis, D. K., Zhu, F. Q., & Martin, E. (2009).
Conformational Analysis of Macrocycles: Finding What Common Search Methods Miss.
Journal of Chemical Information and Modeling, 49(10), 2242-2259.
X-Ray Crystallography
X-ray crystallography is one of the most powerful techniques for determining the atomic-resolution structure of peptides. By analyzing the diffraction pattern of X-rays passing through a crystallized peptide, researchers can infer the three-dimensional structure of the peptide at atomic detail. This method is critical for understanding the conformation of peptides, their interactions with other biomolecules, and their functional roles in biological systems.
Principles of X-ray Crystallography
The core principle of X-ray crystallography lies in the diffraction of X-rays by the electron cloud of atoms within a crystal. When a peptide is crystallized and exposed to X-ray radiation, the scattered rays form a diffraction pattern, which can be captured on a detector. By applying mathematical algorithms, known as the Fourier transform, the electron density map of the peptide is reconstructed. From this map, the positions of individual atoms can be determined, providing detailed insights into the peptide’s structure.1
Preparation and Challenges in Peptide Crystallization
Crystallizing peptides for X-ray diffraction can be challenging due to their small size, flexibility, and tendency to adopt multiple conformations. To overcome these challenges, various crystallization techniques are used, such as vapor diffusion or microbatch under oil. Additionally, co-crystallization with larger molecules, such as proteins or small ligands, can improve the stability of peptide structures and enhance crystal quality. Once high-quality crystals are obtained, they are mounted on a goniometer and exposed to X-rays at synchrotron facilities for data collection.2
Data Collection and Processing
During X-ray crystallography, the crystal is rotated in the X-ray beam, and diffraction patterns are collected from multiple angles. These patterns are analyzed to produce a reciprocal lattice, which provides the spatial frequency of the diffracted rays. By integrating these patterns and applying algorithms such as phasing methods (e.g., molecular replacement or isomorphous replacement), the phase problem is solved, and the electron density map of the peptide can be built. The final model is refined using software to minimize discrepancies between the observed data and the calculated model.3
Applications in Peptide Research
X-ray crystallography plays a vital role in peptide research, particularly in the study of peptide-receptor interactions and the design of peptide-based therapeutics. The detailed structural information obtained through crystallography allows researchers to visualize how peptides bind to their target receptors, which is crucial for developing drugs that mimic or block these interactions. Additionally, structural data from X-ray crystallography can be used to design modified peptides with enhanced stability, binding affinity, or specificity.4
Limitations and Advances
Despite its utility, X-ray crystallography has limitations, particularly in studying flexible peptides or peptides that do not readily crystallize. Some peptides may adopt multiple conformations or remain disordered in solution, making it difficult to obtain high-quality crystals. To address these challenges, researchers are exploring alternatives such as serial femtosecond crystallography, which uses X-ray free-electron lasers, XFELs, to capture diffraction patterns from nanocrystals, providing high-resolution structures without the need for large crystals. This emerging technique shows promise for studying difficult-to-crystallize peptides and proteins.5
Determining X-ray crystallographic phases for peptide crystals is often more challenging than for protein crystals. The abundance of protein structures in the PDB, combined with advances in predictive protein-folding algorithms and molecular replacement software, has made molecular replacement the most common method for phase determination in protein crystallography. In contrast, the limited number of peptide structures in the PDB, particularly for non-helical peptides, restricts the availability of suitable search models for molecular replacement.
The small size of peptides can enable phase determination using direct methods, but this approach requires high-quality diffraction data, often nearing 1.0 Å resolution. When neither molecular replacement nor direct methods are feasible, researchers can incorporate heavy atoms, such as bromide or iodide, into the crystal lattice and use single anomalous diffraction (SAD) phasing. Heavy atoms can be introduced by soaking peptide crystals in heavy-atom solutions or by synthesizing peptide variants with a covalently attached heavy atom.
Protocol 6 & 7
1. Screening for Peptide Crystallization.
The hanging-drop vapor-diffusion method is a common technique for the crystallization of peptides. In this method, a droplet containing equal volumes of the peptide solution and crystallization solution, for example, 0.5–1.0 μL each, is mixed, inverted, and sealed over a well containing the crystallization solution. To screen a peptide for crystallization, prepare 96-well screening plates with crystallization solutions from Hampton Research screens, such as PEG/Ion, Index, and Crystal Screen. Dissolve the peptide in deionized water at a concentration ranging from 5 to 15 mg/mL. The optimal peptide concentration for crystallization is typically determined empirically. Crystallization droplets can be prepared either manually using a pipette or with an automated pipetting robot, such as the SPT Labtech Mosquito, which can prepare smaller droplets with volumes as low as 100 nL. Seal the plates securely to prevent evaporation, then examine the droplets under a stereo microscope after 1 to 24 hours to identify potential crystals. Recheck the plates every 24 to 48 hours, and optimize the conditions for droplets that yield crystals as needed.
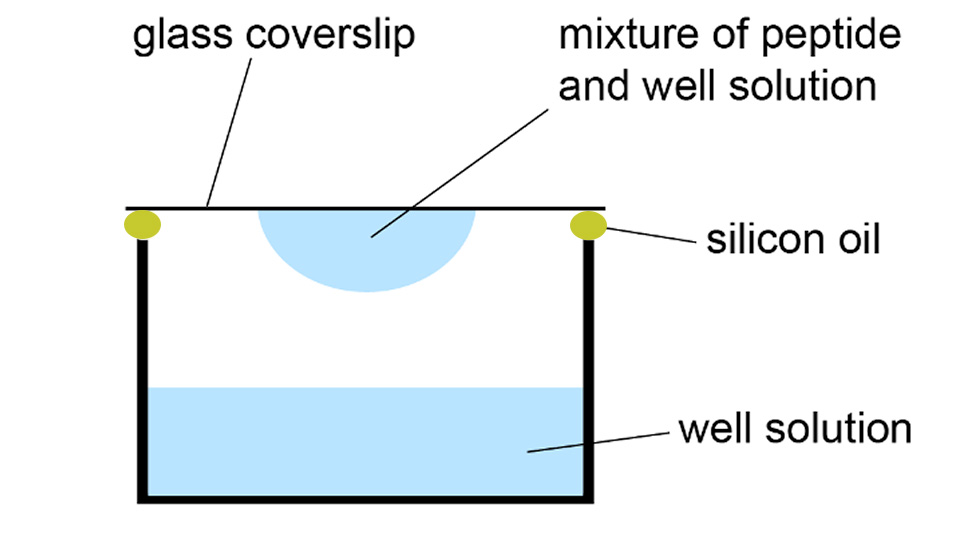
Hanging-drop vapor-diffusion method for peptide crystallization.
2. Optimizing Peptide Crystallization.
To optimize peptide crystallization conditions, prepare a peptide solution in water and concentrated solutions of relevant buffers, salts, or cryoprotectants, filtering them through a 0.22 μm filter. Using a 24-well plate with siliconized rims, create a matrix by systematically varying two properties of the crystallization condition, such as buffer pH and cryoprotectant concentration. Pipette the appropriate volumes into each well to achieve a final volume of 1 mL per well, adjusting with water as needed. Prepare three drops on a siliconized cover slide by mixing the peptide solution and well solution in 1:1, 2:1, and 1:2 ratios. Invert the slide onto the 24-well plate, ensuring a firm seal with silicone grease. Examine the droplets under a stereo microscope after 1–24 hours and reexamine every 24–48 hours to identify crystals. Harvest crystals of suitable quality for X-ray diffraction studies and freeze in liquid nitrogen.
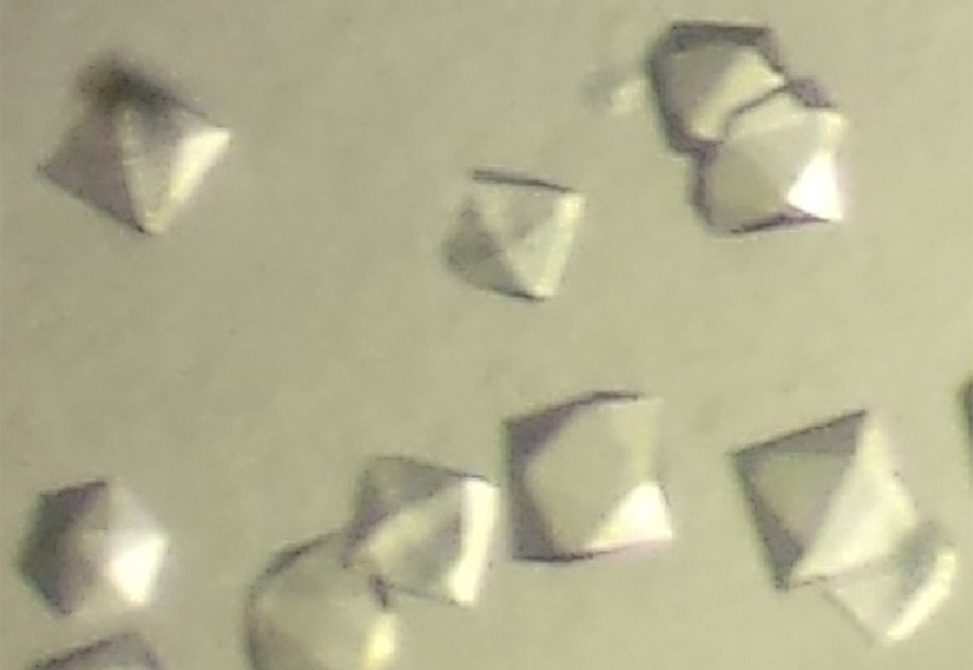
Optimized peptide crystals.
3. Preparing Peptide Crystals for X-ray Diffraction.
To diffract peptide crystals, select an appropriately sized CryoLoop to scoop up the peptide crystal. Use a razor blade to carefully lift the glass coverslip containing the crystal drop, placing it drop-side-up on the tray lid for better focus. If cryoprotection is required, mix 1 μL of cryoprotectant with 1 μL of well-solution in a drop next to the drop you are harvesting the crystal from. Scoop the crystal with the CryoLoop, and if needed, dip it in the cryoprotectant, swirling gently to remove excess aqueous solution. Finally, mount the crystal on a goniometer, center it relative to the X-ray beam, and maintain it in a liquid nitrogen stream for diffraction. Diffraction data can be collected using in-house X-ray diffractometers with copper anodes that produce 1.54 Å X-rays or at synchrotron sources, which typically produce higher-resolution 1.0 Å X-rays.
4. Collecting X-ray diffraction data.
Initial diffraction images are taken at different angles to assess diffraction quality; high-quality crystals produce well-defined, round spots and diffract to high resolution. Typically, a few images are collected to index the crystal, determining its cell dimensions, angles, and potential space group. For crystals with high-quality diffraction, a complete data set is collected by rotating the crystal in 0.5° or 1° increments and capturing diffraction images through a full 360° rotation.
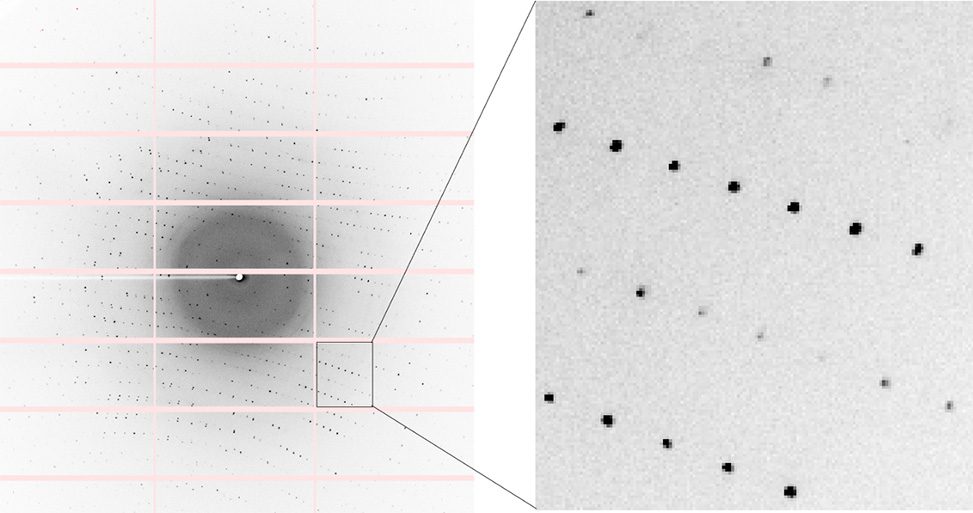
Diffraction image of peptide crystal acquired on synchrotron beamline 5.0.2 at the Advanced Light Source.
5. Processing Peptide Crystal Diffraction Data.
After collecting a crystal diffraction data set, the data is processed in several steps: indexing, integration, scaling, and merging into a single reflection file. XDS is commonly used for indexing and integration, and Pointless and Aimless are used to determine the most probable space group, merge data, and assess data quality. Additional graphical user interface software options, such as iMosflm, HKL2000, and d*TREK, are also available for data processing.
6. Solving Peptide Crystal Structures.
The process of solving peptide crystal structures involves assessing data quality, determining X-ray crystallographic phases, generating an electron density map, and building a structural model.
These steps can be performed using widely available software suites such as ccp4 or Phenix, which provides tools for data processing, phase determination, electron density map generation, and model building. Many crystallography programs within Phenix include detailed user guides, making them accessible to a broad audience.
To solve X-ray crystallographic phases for peptide crystals, the most common initial approach is molecular replacement, provided a suitable search model exists. If molecular replacement is unsuccessful, alternative methods such as incorporating heavy atoms into the crystal lattice and then using single-wavelength anomalous diffraction, SAD, phasing can be employed. Heavy atoms like iodide or bromide may be introduced by soaking crystals in solutions containing salts like potassium iodide or sodium bromide. Additionally, if the peptide contains disulfide cross-links or methionine residues, sulfur single-wavelength anomalous diffraction, S-SAD, phasing can be attempted.
In cases where soaking is insufficient or inappropriate, heavy atoms can be directly incorporated into the peptide during synthesis by substituting a suitable residue with one containing a heavy atom, such as phenylalanine to para-iodophenylalanine, leucine to (2-bromoallyl)glycine, or methionine to selenomethionine. These methods provide flexibility in solving challenging structures, particularly for large or complex peptides.
7. Model building and refinement.
Once an electron density map and preliminary structural model are generated, they are loaded into a macromolecular model-building program such as Coot. Coot is used to build, edit, and manipulate models to fit the electron density map. During this process, residues, side chains, and solvent molecules are manually adjusted to fit the observed density.
After initial model building, the structure undergoes iterative cycles of refinement and manual adjustment to improve the model’s agreement with experimental data. Refinement is typically performed using tools like phenix.refine from the Phenix software suite. This step optimizes the model by adjusting atomic positions, B-factors, and occupancies to minimize the crystallographic R-factors, Rwork and Rfree, which measure the agreement between the model and the observed diffraction data.
During refinement, validation tools are employed to ensure that the model adheres to stereochemical restraints, such as correct bond angles and lengths, and that no unusual structural features are present unless supported by the data. For peptides, particular attention is given to ensuring accurate placement of side chains and loops, which are often more flexible than the peptide backbone and can result in poorly defined electron density.
Additional rounds of refinement may involve introducing water molecules, ligands, or ions into the model, guided by unmodeled electron density. For peptides with complex geometries or non-standard residues, custom restraints may need to be applied during refinement. This iterative process continues until the model achieves the highest possible accuracy and reliably represents the peptide’s crystal structure. The structure is then deposited in the RCSB Protein Databank.
Contribution from Drs. Adam Kreutzer and James Nowick, UC Irvine
Citations
-
Drenth, J. (2007). Principles of protein X-ray crystallography (pp. 45–67). Springer.
-
Cherezov, V., Rosenbaum, D. M., Hanson, M. A., Rasmussen, S. G. F., Thian, F. S., Kobilka, T. S., & Kobilka, B. K. (2007). Crystallization of membrane proteins in lipidic mesophases: A mechanistic perspective. Science, 317(5839), 377–381. https://doi.org/10.1126/science.1139266
-
Rupp, B. (2010). Biomolecular crystallography: Principles, practice, and application to structural biology (pp. 423–460). Garland Science.
-
Müller, A., Broghammer, J., & Börner, A. (2015). X-ray crystallography in drug design: Peptide-receptor interaction studies. Journal of Structural Biology, 191(2), 236–245. https://doi.org/10.1016/j.jsb.2015.07.010
-
Chapman, H. N., Fromme, P., Barty, A., White, T. A., Kirian, R. A., Aquila, A., … & Spence, J. C. H. (2011). Femtosecond X-ray protein nanocrystallography. Nature, 470(7332), 73–77. https://doi.org/10.1038/nature09750
-
Spencer, R. K., & Nowick, J. S. (2015). A newcomer′s guide to peptide crystallography. Israel Journal of Chemistry, 55, 698–710.
-
Guaglianone, G., Kreutzer, A. G., & Nowick, J. S. (2021). In Petersson, E. J. (Ed.), Methods in Enzymology (Vol. 656, pp. 123–168). Academic Press.
Immobilized Artificial Membrane Chromatography – IAM
Immobilized Artificial Membrane, IAM, chromatography is a method to create an immobilized phospholipid environment of a cell membrane on HPLC grade silica stationary phase. The IAM stationary phases are developed by covalently attaching the phospholipids to an amino-propyl silica stationary phase. The commercially available IAM HPLC column contains phosphatidyl choline on silica particles.
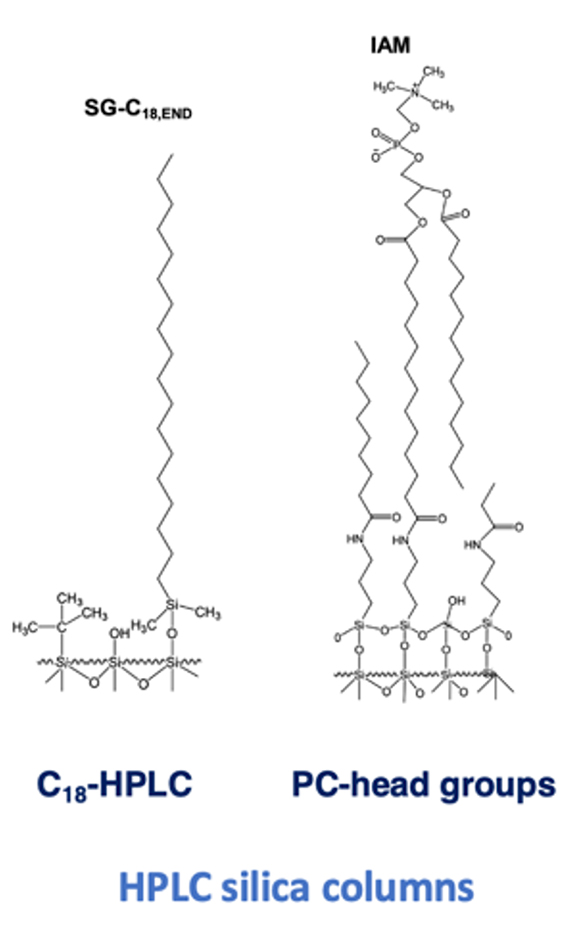
Estimation of drug permeation and drug-membrane interaction by IAM chromatography involves the determination of retention factor of compounds on IAM stationary phase. A gradient method with acetonitrile on IAM HPLC column provides a chromatographic hydrophobicity index, CHI IAM, that the gradient retention times are calibrated with data obtained from isocratic measurements of reference compounds, see Table 1. CHI IAM values are then converted to the lipophilicity scale, log k IAM, using the equation that is obtained from plotting the isocratic log k values of reference compounds against CHI IAM values.
log k (IAM) = 0.0046 x CHI (IAM) + 0.42
The log k IAM is referred as the partition coefficient of a compound between an aqueous phase and an immobilized artificial membrane. This coefficient can be used to predict the compound’s potential passive diffusion.
Method
|
Column: |
IAM column (150 x 4.6 mm) |
|
Mobile phase A: |
50 mM ammonium acetate pH 7.4 |
|
Mobile phase B: |
acetonitrile |
|
Flow rate: |
2.0 ml/min |
| Gradient: |
0 to 2.5 min 0 to 70% solvent B |
Reference molecules are prepared in a concentration of 0.5 mg/ml in 50% Acetonitrile and 50% ammonium acetate pH 7.4 solution mixture. CHI IAM of reference molecules for calibration is measured with isocratic method to obtain a calibration curve.
Table of Reference compounds for calibration of CHI IAM values
| Compound | Retention time (tR) min | CHI IAM | Log k IAM |
|---|---|---|---|
| Octanophenone | 3.18 | 49.4 | 2.69 |
| Heptanophenone | 3.07 | 45.7 | 2.52 |
| Hexanophenone | 2.94 | 41.8 | 2.34 |
| Valerophenone | 2.79 | 37.3 | 2.14 |
| Butyrophenone | 2.58 | 32 | 1.89 |
| Propiophenone | 2.35 | 25.9 | 1.61 |
| Acetophenone | 2.04 | 17.2 | 1.21 |
| Acetanilide | 1.85 | 11.5 | 0.95 |
| Paracetamol | 1.62 | 2.9 | 0.55 |
More Readings
Ermondi, G., Vallaro, M., & Caron, G. (2018). Learning how to use IAM chromatography for predicting permeability. European Journal of Pharmaceutical Sciences, 114, 385–390.
Taillardat-Bertschinger, P. A., Carrupt, F., Barbato, B., & Testa, B. (2003). Immobilized Artificial Membrane HPLC in drug research. Journal of Medicinal Chemistry, 46, 655–665.
Giaginis, A., & Tsantili-Kakoulidou, E. (2008). Alternative measures of lipophilicity: From octanol/water partitioning to IAM retention. Journal of Pharmaceutical Sciences, 97, 2984–3004.
Valko, K., Du, C. M., Bevan, C., Reynolds, D. P., & Abraham, M. H. (2001). Rapid method for the estimation of octanol/water partition coefficient (log Poct) from gradient RP-HPLC: Application of high-performance liquid chromatography in drug discovery retention and a hydrogen bond acidity term (Σα2H). Current Medicinal Chemistry, 8, 1137–1146.
Janicka, M., Sztanke, M., & Sztanke, K. (2020). Predicting the blood-brain barrier permeability of new drug-like compounds via HPLC with various stationary phases. Molecules, 25, 487.
Valko, K., Rava, S., Bunally, S., & Anderson, S. (2020). Revisiting the application of immobilized artificial membrane (IAM) chromatography to estimate in vivo distribution properties of drug discovery compounds based on the model of marketed drugs. ADMET and DMPK, 8(1), 78.
Tsopelas, F., Stergiopoulos, C., Tsakanika, L. A., Ochsenkuhn-Petropoulou, M., & Tsantili-Kakoulidou, A. (2017). The use of immobilized artificial membrane chromatography to predict bioconcentration of pharmaceutical compounds. Ecotoxicology and Environmental Safety, 139, 150.

